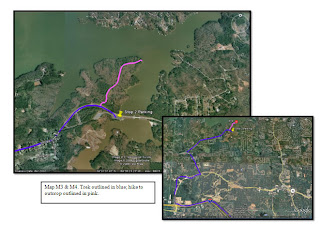
 As I was archiving old reports and papers, I came across a field report where I implemented Google Earth and an iphone app (MotionX GPS) for the first time. The tracking on MotionX GPS wasn't too bad, but I found it challenging to use at the time because I had downloaded the app the night before and neglected to read the user guide beforehand. As a result, I didn't get optimal results (as I personally would have wished), but the report fulfilled the template required by the professor. I personally did not care for the format that was asked of us, but that is most likely due to the fact that I was used a previous institution's field report format. With that issue aside, the process is pretty much the same. I used Google Earth for the map of the area and the iphone app provided the track taken. Being as I was unfamiliar with the app, I didn't care for the end result, so I doctored it in Adobe Photoshop. (Top right image). The outlined pink area was the hike we took in order to access the Pumpkinvine fm. The original track wasn't as smooth as I would have liked, but it was fairly accurate in terms of location. I didn't think using Google Earth was that big of deal, but on one particular stop (in a different location) I was able to get an image of the entire outcrop via Google Earth that I was unable to shoot myself due to the aspect that it was along a 4 lane hwy near an overpass. This seemed to surprise the professor, so I'm guessing not many students at that particular school took advantage of what it can do. If color pictures aren't your thing, or you want it to look more unique, an easy process of adding layers and drawing out the map (can be done in Illustrator better with this method) by hand can be done by just tracing the underlying layer. ArcGIS also does this, but unfortunately I no longer have a version of it, as it expired 6 mos. after my GIS class was completed. Therefore I just use Photoshop and Illustrator.
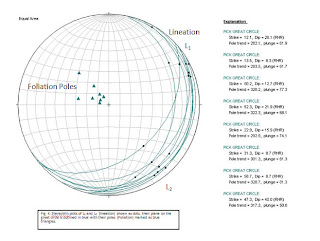
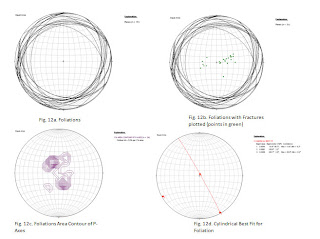
To import images of the stereonets, I did the basic 'PRTSC' technique and pasted it into Photoshop to save as a JPEG. I wasn't sure what the professor was wanting in this section, so I just provided copies of all the stereonets I did- one with just my data points, and one with mine and the groups combined. Then I did a few different formats, explaining them all in the report. I had learned from a rush job I once did in field camp -along with quite a few of my peers- that you never attach a stereonet to your reports without an explanation.(oops). Once I completed all the graphics, I imported them into PPT. I then am able to label them accordingly as I write up my report (which I do in MSword). Since I edit a lot, it is easier to leave the images in PPT and use text blocks. This generally applies only to maps and diagrams. Pictures of a rock, or anything illustrating a procedure, I place within the body of the report itself. However, I keep these at a minimum to avoid making the report unnecessarily bulky.
.


No comments:
Post a Comment